Skip to content
braided STEM
  • Home
  • Register
  • #STEMontheCheap
  • Resources
  • Hire Us
  • About
    • Privacy Policy
braided STEM
Facebook Linkedin Youtube Email
  • Home
  • Register
  • #STEMontheCheap
  • Resources
  • Hire Us
  • About
    • Privacy Policy

Day 2 – Energy

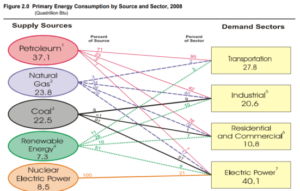
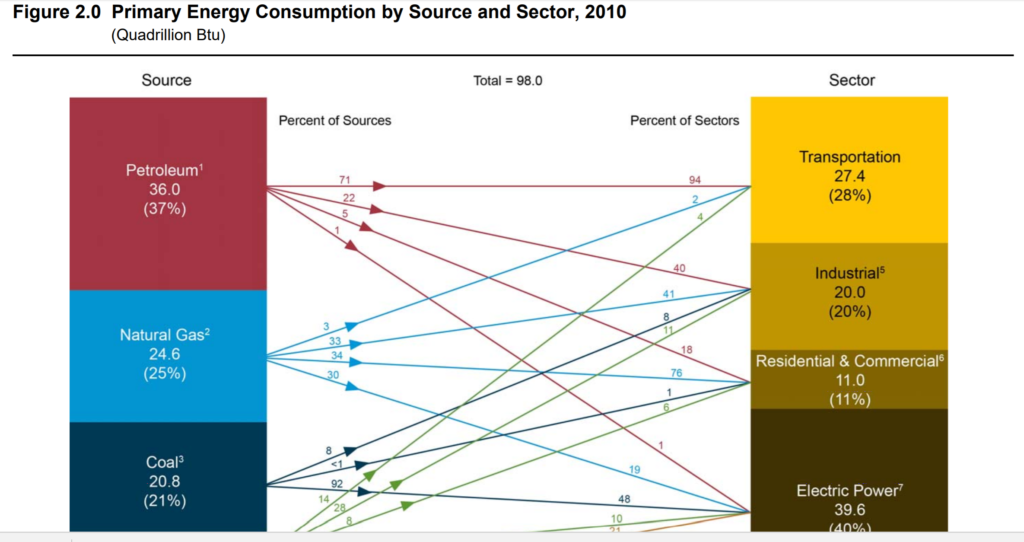
2010 U.S. Primary Energy Consumption by Source and Sector


Read More

2009 U.S. Primary Energy Consumption by Source and Sector

Read More

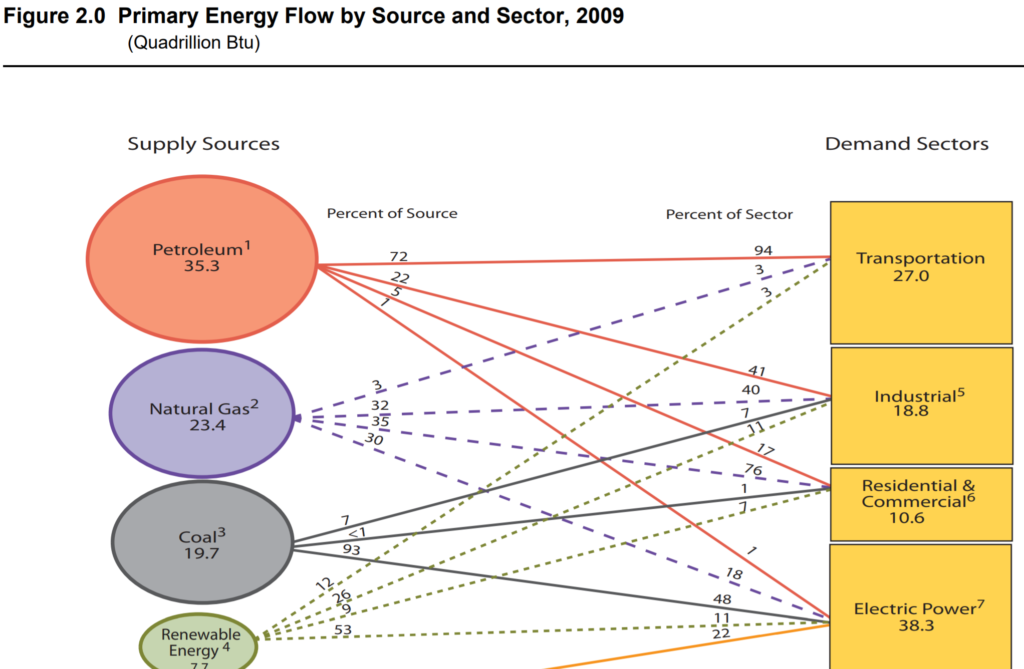
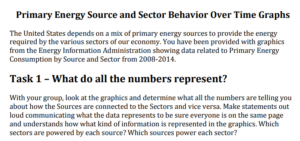
Energy Information Administration U.S. Primary Energy Consumption by Source and Sector Graphics

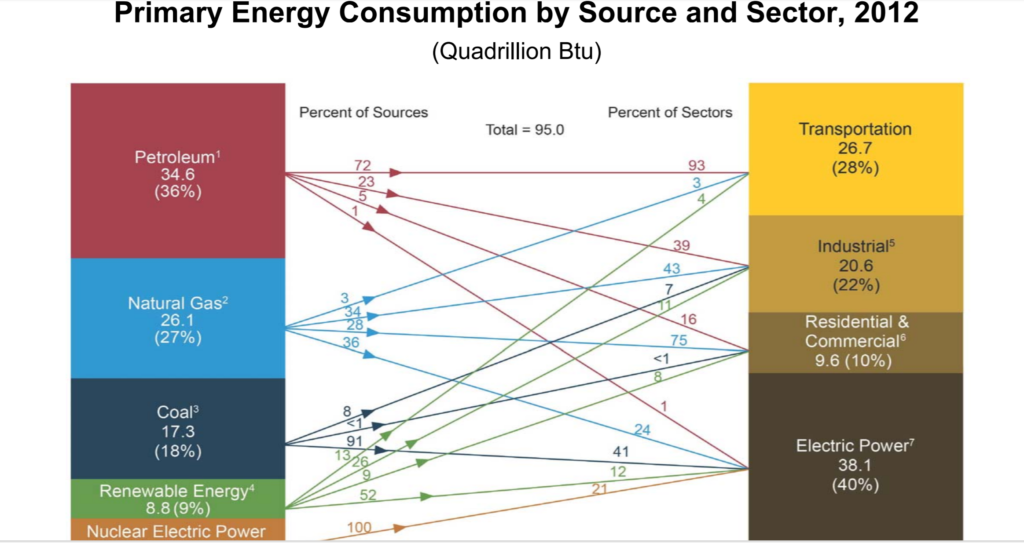
Graphics from the Energy Information Administration showing U.S. primary energy consumption by source and sector for each year from 2008-2017. The change over time lesson will engage your students to make sense of the data represented in the graphics and to track a particular trends and how they might be changing over time.

Read More

2008 U.S. Primary Energy Consumption by Source and Sector


Read More

Behavior Over Time for Energy Source and Sector


Read More

Forms of Energy


Read More

Power Generation 101 PowerPoint


Read More

Violin Generator Directions

From Dr. Shropshire (Idaho State University)

Read More

Alex Laskey: How behavioral science can lower your energy bill

Read More

Science of Energy PowerPoint


Read More
« Newer Posts
© 2025 braided STEM
Scroll To Top